QGIS Gravity Model
Leaflet Map
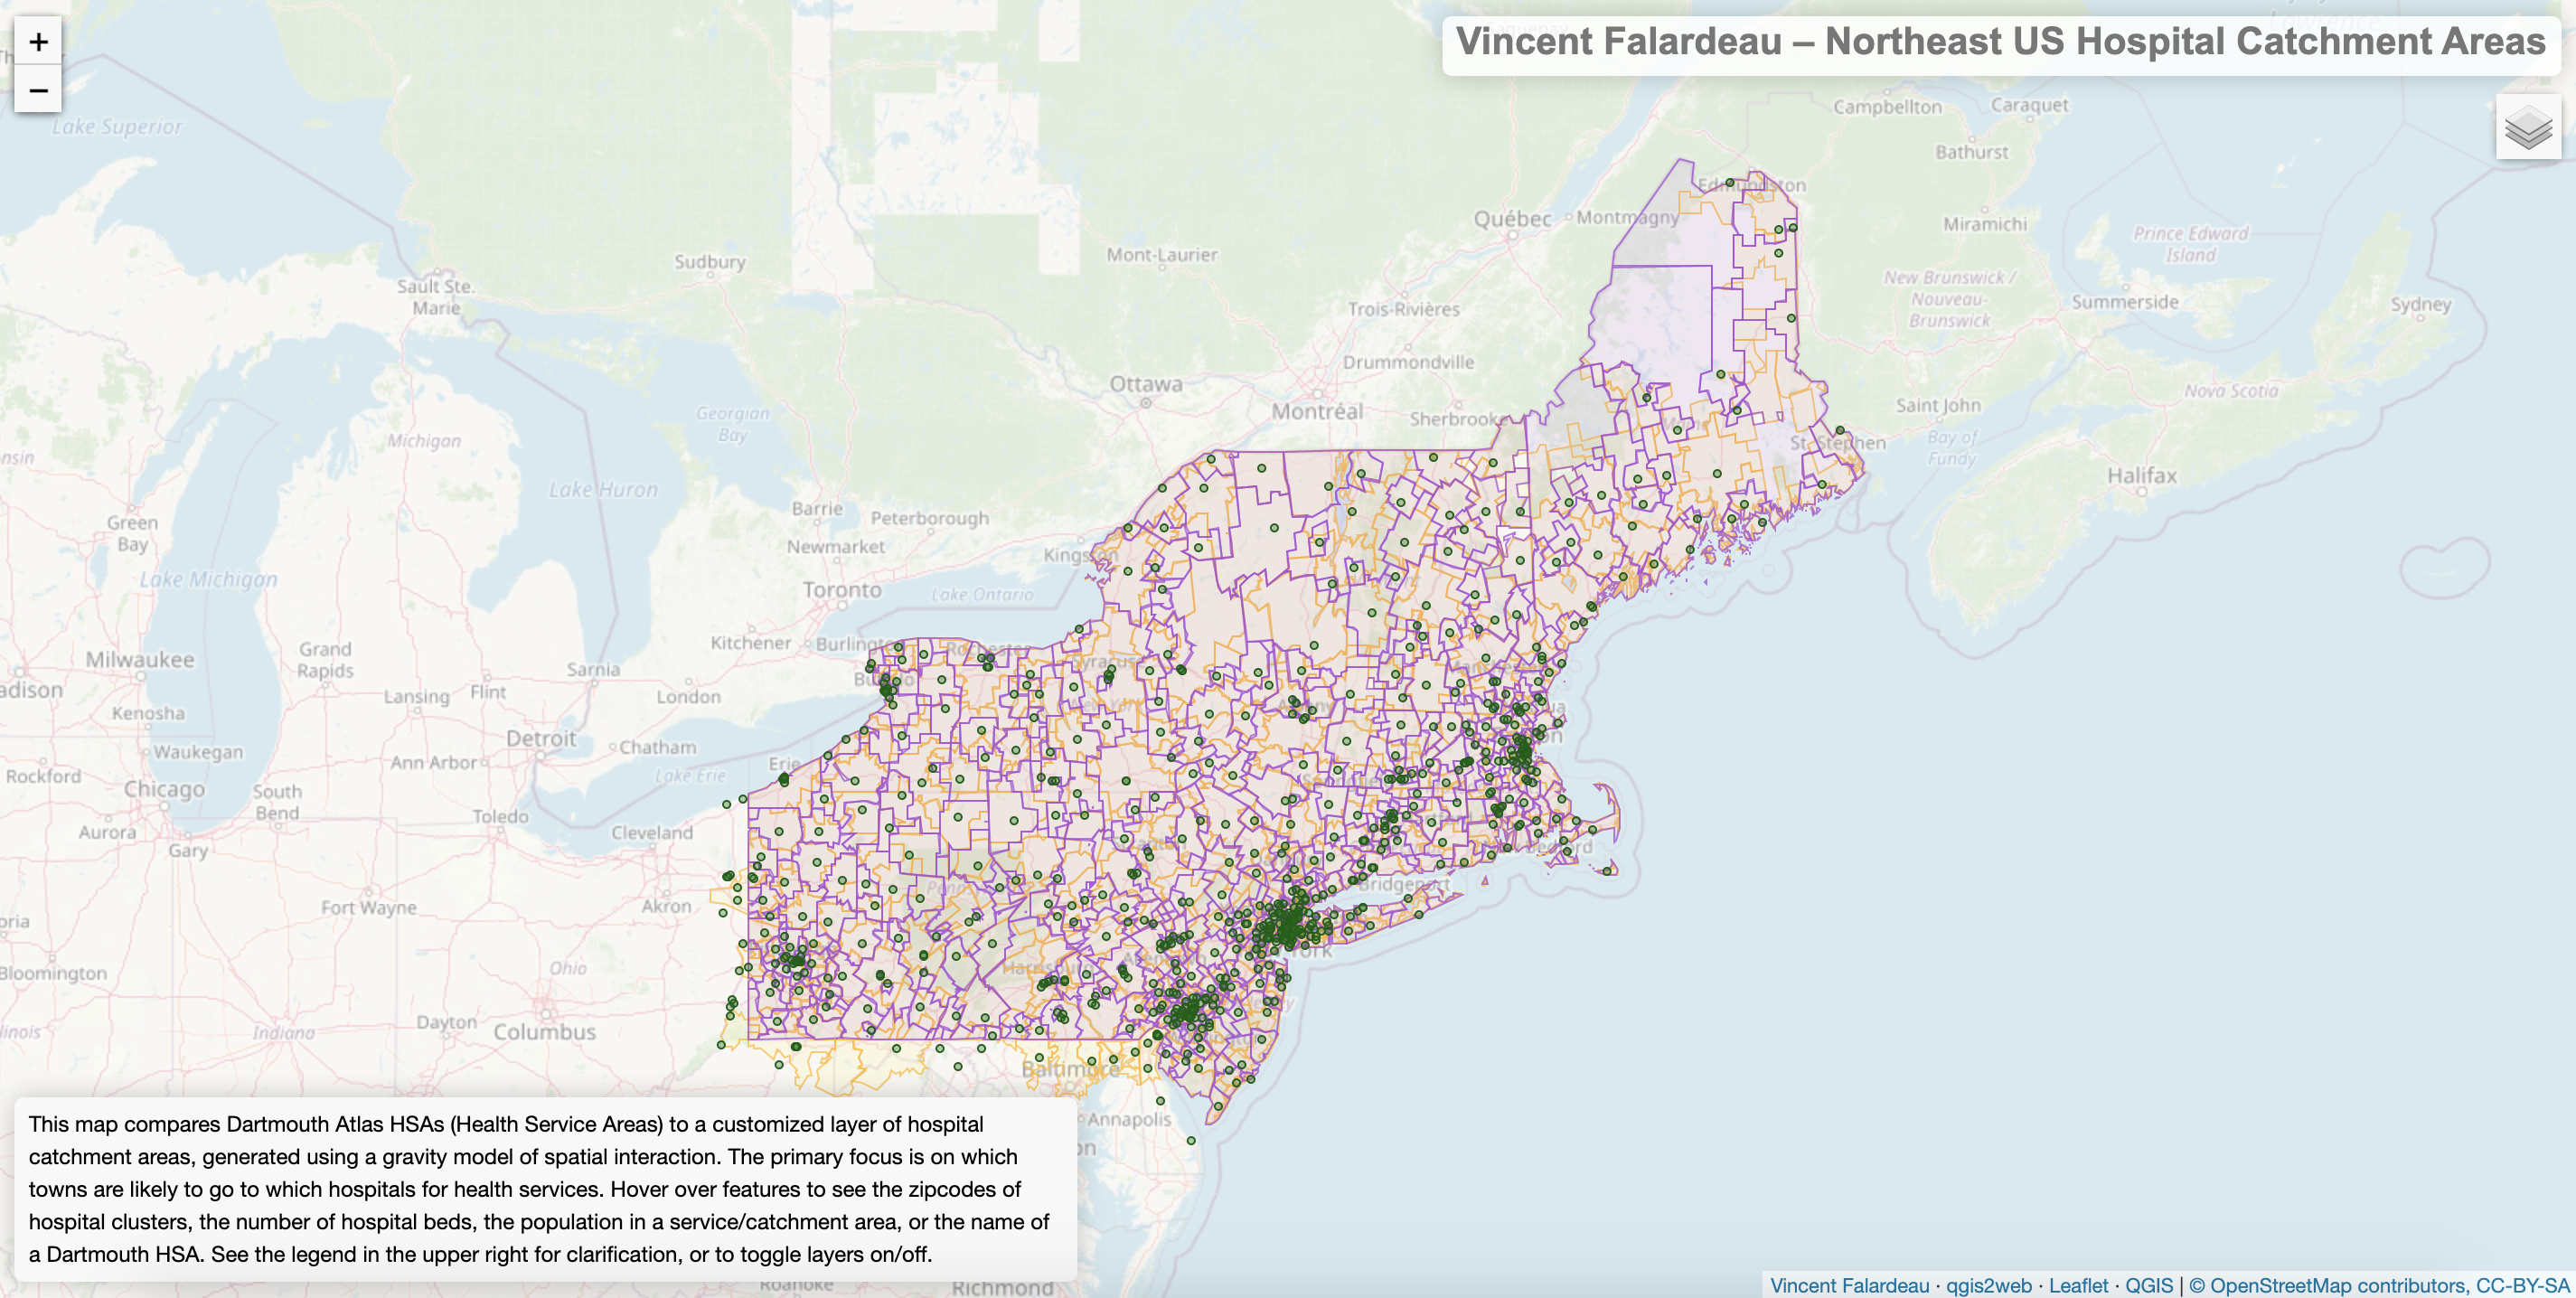
Here is a link to a leaflet map of hospital catchment areas in the Northeast US, derived from a customized gravity model of spatial interaction in QGIS. Click the link or the screenshot below to be brought to full-screen webpage with the leaflet map.
Methods and Models
Individual interactions with the American health system are shaped by a number of complex social, economic, geographic, and political factors. Insurance coverage or lack thereof, affordability, personal relationships with doctors, and countless other considerations can motivate people to go to (or not to go to) specific hospitals. That said, populations do generally interact the most with the nearest hospitals that have sufficient capacity for the population’s needs. Thus, a gravity model can map theoretical service areas around hospitals, accounting for distance decay, population size, and hospital capacity.
The gravity model formula estimates the interaction between a given input and target feature as (Input Weight)^λ * (Target Weight)^⍺ / (Distance)^β. The exponents are the emissivity of input features (λ), the attractiveness of target features (⍺), and the friction of distance (β). Further details on the gravity model can be found in Appendix A of Dr. Jean-Paul Rodrigue’s textbook The Geography of Transport Systems.
This project consists of two models for mapping hospital catchment areas in the Northeast, one for processing hospital data, and one for applying the gravity model formula. Click here to download the QGIS model that cleans up the hospital data: HospitalPreprocessing. And here is the gravity model of spatial interaction, DistanceMatrixCatchmentAreas.
Hospital Pre-processing Model
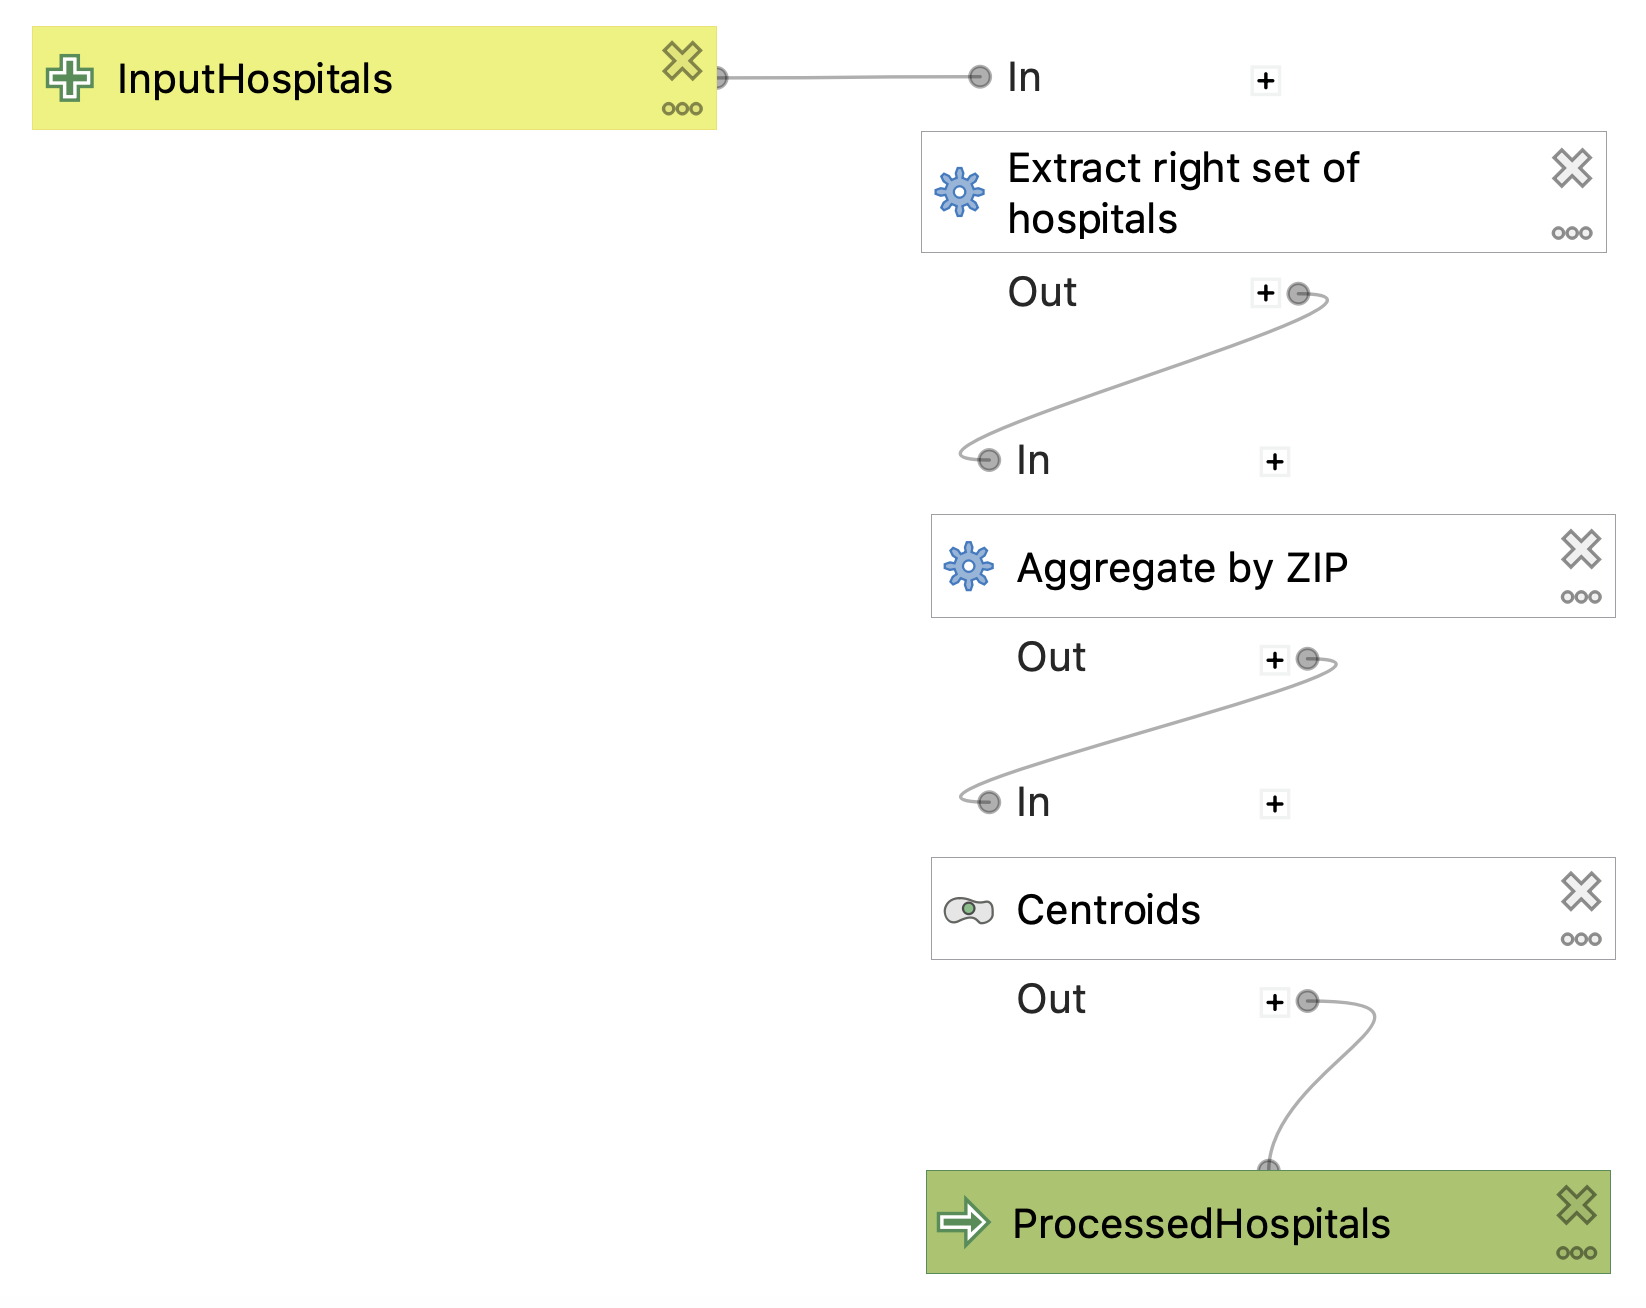
The hospital pre-processing model is designed to clean up the Department of Homeland Security hospital data prior to use in the gravity model. To extend this model to other hospital data, the fields of the attribute table would have to follow the same naming convention and contain similar values. The first step is to narrow down the hospitals to the ones that are appropriate for the current application; using extract by expression, we exclude psychiatric and military hospitals, closed hospitals, and hospitals with no data on the number of beds. Next, the hospitals are aggregated by common zip code (taking the sum of the number of beds) so that clusters of hospitals very near one another will be considered together in the next model. Finally, the model generates a single centroid point for each cluster of hospitals in a single zip code.
Distance Matrix Catchment Areas Model
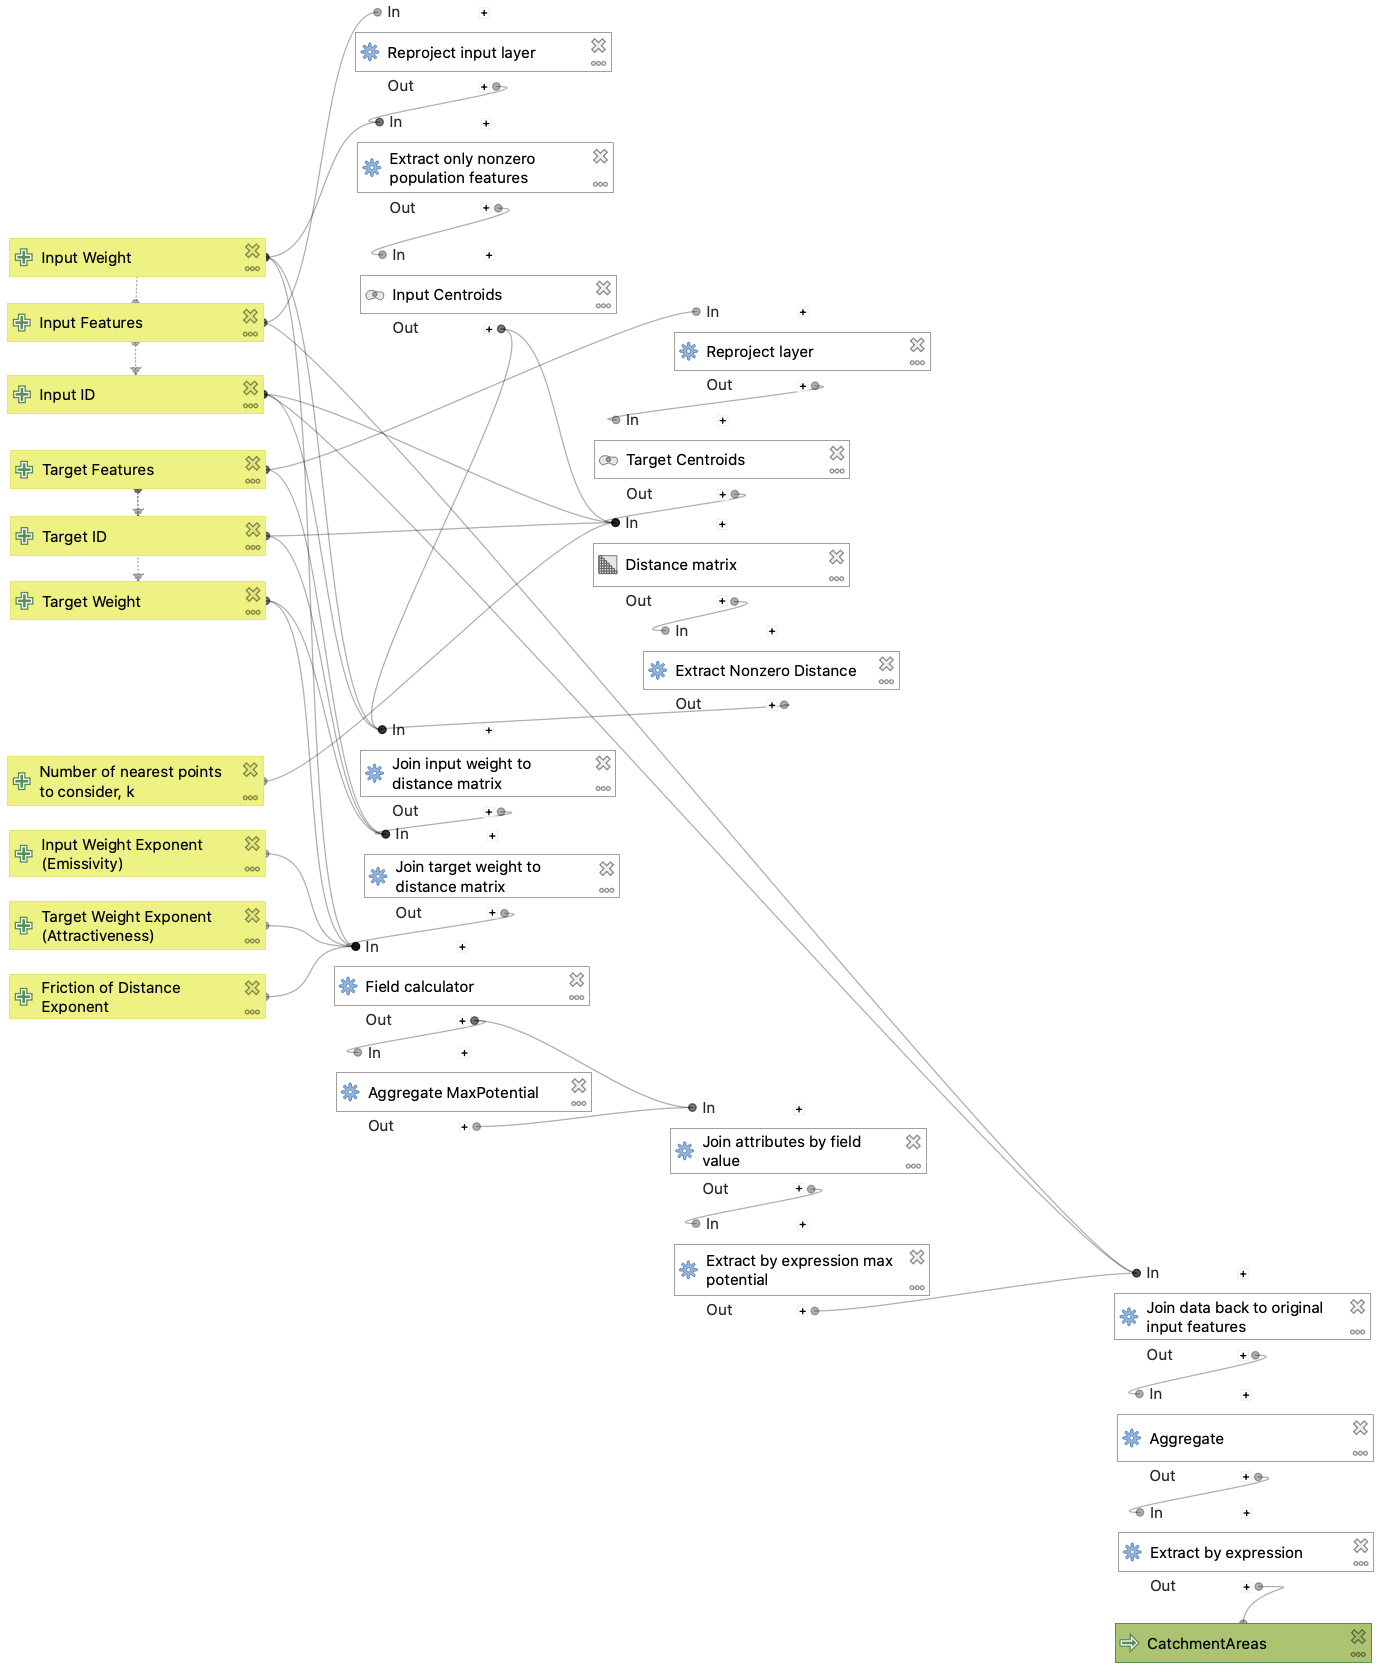
The purpose of the catchment areas model, in this case, is to group towns by the hospitals that seem ideally suited for them, both geographically and in terms of the town population and number of hospital beds. The model employs a gravity model of spatial interaction, where the potential for interaction between a town and a hospital is weighted by the population and beds, and decreases with distance. The advanced parameters of the model allow the user to customize exponents in the ‘gravity’ equation; thus, friction of distance can be increased or decreased, and the town population or number of hospital beds can be emphasized or de-emphasized. The end result of the model is a set of polygonal areas that would theoretically be served by a single hospital. This can then be compared with the Dartmouth Atlas of Hospital Service Areas, which reflects the reality of which hospitals are used most by the residents of various zip codes.
The model is also designed to be generalizable and reproducible, so it can be used with just about any two vector layers, as long as they have unique ID fields and fields with data that can be used to weight the interaction potential between input and target features. For example, the model could be used to create theoretical service areas around competing businesses.
The leaflet map linked above was created using this catchment areas model, with a couple of modifications to the parameters. The default number (k) of nearest points to consider is 20, but I ran the model with k=12, to limit the potential for more distant populations and hospitals to dominate the smaller, but nearer ones. Also, the default exponent (β) for the friction of distance is 2, but I ran the model with β=2.3, slightly higher in order to encourage the model to give greater consideration to distance, and not just to the population size and number of hospital beds, which exercise a strong influence on the model as it is.
Discussion
Generally speaking, the customized catchment areas often do well compared to the Dartmouth Atlas in the rural areas of the Northeast US, where hospitals are more spread out. In these cases, distance is the dominant factor in determining which hospital a town’s population is likeliest to use. On the other hand, the model does not do quite as well in populous areas where the hospitals are relatively close to one another. When the differences between hospital distances are less significant, the model is dominated by the number of hospital beds, so the catchment areas become too large, with too many zip codes all aggregated into the catchment areas of larger hospitals. This might be partially corrected with a higher exponent on the distance in the ‘gravity’ equation, and with a lower ‘attractiveness’ exponent on the number of beds. Of course, some issues are engrained in the model itself. For instance, the model uses a distance matrix that calculates ‘as-the-crow-flies’ distance, failing to account for the road network, which determines how long it takes to get to different hospitals. In the final analysis, any theoretical model can only approximate the complex reality of dynamic human systems.
Data Sources and References
-
Town data for the Northeast US from the American Community Survey’s 2018 5-year average, collected using TidyCensus in R and put in geopackage format: netowns.gpkg
-
Hospital data from the Department of Homeland Security, also available in an updating feature server, here. Here it is as a shapefile.
-
Hospital Service Area data from the Dartmouth Atlas website, and in shapefile format here. The hospital service area data used and set forth on this website was obtained from Dartmouth Atlas Data website, which was funded by the Robert Wood Johnson Foundation, The Dartmouth Clinical and Translational Science Institute, under award number UL1TR001086 from the National Center for Advancing Translational Sciences (NCATS) of the National Institutes of Health (NIH), and in part, by the National Institute of Aging, under award number U01 AG046830.