Chicago Hospital Accessibility & COVID-19
Original materials available in this repository: cybergis/COVID-19AccessibilityNotebook.
Reproduction materials available in this RP-Kang repository.
Introduction
In the early months of the COVID-19 pandemic, Kang et al (2020) set out to rapidly measure the accessibility of hospitals in Chicago and throughout Illinois, for both vulnerable populations (people over 50 years old, in their analysis) and for actual COVID-19 patients. The study also separately measured access in terms of ICU beds and ventilators. Kang et al employ an enhanced two-step floating catchment area (E2SFCA) method, as outlined in Luo and Qi (2009). Kang et al have maintained a publicly available Jupyter Notebook, allowing reproduction of their study, and they have kept up a COVID-19 hospital accessibility dashboard for Illinois. The study uses network distance to measure how long it would take to drive between each hospital and the nearest census tract(s), and since the road network is very complex, the authors used cutting-edge cyberinfrastructure for the GIS workflow, allowing processes to run remotely on servers. Kang et al propose that their analysis provides useful information regarding how existing and new health resources should be distributed by “policymakers and public health practicioners” in order to optimize access for everyone. Therefore, reproducing the paper by running and/or modifying the code the authors have provided is an important step towards verifying the results and investigating whether any methods could be improved. Doing a reproduction of Kang et al should also reveal how this kind of analysis might be carried out in other states or regions.
Materials and Methods
The materials and inputs involved in this reproduction are as follows:
- Chicago census tract population data, including total population and population over fifty
- Hospital data, including the number of ICU beds and ventilators
- Hexagon grid over Chicago, in which to measure hospital accessibility
- Road network, obtained from OpenStreetMap
Of the seven researchers involved in the original study, five work at the University of Illinois at Urbana-Champaign, which is home to the CyberGIS Center for Advanced Digital and Spatial Studies. The CyberGIS Center manages the CyberGISX platform, which is designed to allow cutting-edge geospatial research at a large scale using cyberinfrastructure. The paper by Kang et al. works in the CyberGISX-Jupyter environment, using a publicly available notebook, which you can then open in CyberGISX once you have signed up to create an account. From there, you can run and modify the code independently to get a better idea for how it works!
To briefly sketch the methods in the code by Kang et al: the CyberGISX Jupyter Notebook begins by reading in all of the input files, then processes the road network to remove isolated nodes (dead-ends and self-contained bits of the road network). The code also sets the default network speed to 35 mph where there is no speed limit data available from OSM. In our reproduction, it was sometimes necessary to over-ride original speed limits that were entered into OSM with syntax that confused the code; for instance, one-way streets with speed limits like “25, east” threw errors in the code, which expected entries like “25 mph.” After processing the roads, the code snaps the hospitals to the nearest network nodes so they can be included in network analysis. This made the code as provided somewhat inaccurate, since hospitals just outside Chicago did not have any nodes close nearby – we remedied this in the reproduction by expanding the road network to a 30-km buffer around Chicago. Next the code makes population centroids, derives catchment areas around hospitals, and computes the influence a hospital exerts on its catchment area. Then accessibility is measured for each hospital, weighted by distance, and an overlapping function takes the sum of accessibility in each hexagon of the grid. After normalization as a final step, the result is a map of hospital accessibility throughout Chicago.
One minor change I made to the code of the original study was to edit the distance weights applied in the accessibility calculation. Kang et al used a set of weights (1.00 at 10 minutes’ driving distance, 0.68 at 20 min, and 0.22 at 30 minutes) from an earlier paper on access to physicians’ offices in Illinois – Luo and Qi (2009). Figure 1 represents a map made with these weights and the unchanged methods of the original code, while Figure 2 uses the same weights but fixes the code to include a larger road network. These weights do provide reasonable results, but it might prove interesting to interrogate the distance weights further. For instance, Luo and Qi also tested a set of weights that reflect sharper distance decay, 1.00 at 10 minutes, 0.42 at 20 minutes, and 0.09 at 30 minutes. Applying these weights results in Figure 3, which shows consistently lower accessibility throughout much of Chicago. These weights would make sense if there was extreme urgency associated with getting to the hospital quickly, ideally within 10 minutes or so. However, the onset of COVID-19 is not extremely acute, so people might be more willing to drive farther for a hospital that better serves their needs, whether in terms of ICU beds, ventilators, or simple preference. Therefore, a set of weights that drops off more gradually could make more sense. For that reason, I made another map (Figure 4) with slower distance decay, using these customized weights: 1.00 at 10 minutes, 0.95 at 15 minutes, 0.87 at 20 minutes, 0.75 at 25 minutes, and 0.63 at 30 minutes. In this model, any given person is about 3/4 as likely to go to a hospital 25 minutes away as they are to go to a hospital 10 minutes away.
Results and Discussion
First of all, the difference between Figures 1 & 2 illustrates just how important it was to include a larger road network, buffering by 30 kilometers around Chicago proper. By doing so, we avoid false areas of low accessibility in northwest Chicago and along the western edge of the city. These areas are served well enough by hospitals just outside of city bounds.
All of the different distance weights (Figures 2, 3, and 4) reveal that the center of Chicago has the greatest accessibility to nearby hospitals with good ICU and ventilator capacity. Meanwhile, they show that the southeast consistently has the lowest access. However, the differences between these three maps also show that the choice of weighting scheme can have a significant impact on the results. For instance, with a sharper distance decay (Figure 3), the center of Chicago retains its high accessibility values, but an outer ring around the city center drops considerably, as distant hospitals become less impactful. In the opposite direction, a slower distance decay (Figure 4) seems to suggest that accessibility is fairly good just about everywhere in Chicago. The difference between these maps could be the difference between more and less resource allocation to Chicago during the COVID-19 pandemic, so it is important to think about just what the distance weights mean.
One way to make a more accurate map of hospital accessibility would be to survey people about which hospitals they go to, and how far they travel to reach them. Survey data of this kind could be used to calibrate the distance weights, making them match how people actually behave. Also, this study might furnish different results if it used a gravity model of spatial interaction, rather than checking whether census tract centroids do or don’t fall within a certain distance of hospitals.
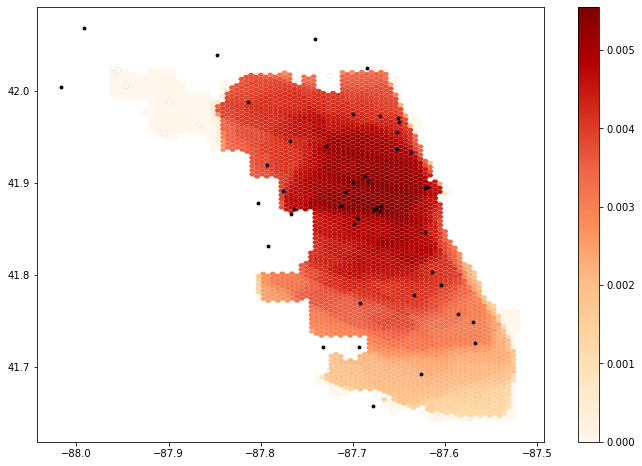
Figure 1. Map showing the results of E2SFCA as applied by the authors’ provided code. Note the false areas of low accessibility in the northwest of Chicago and along the western edge of the city.
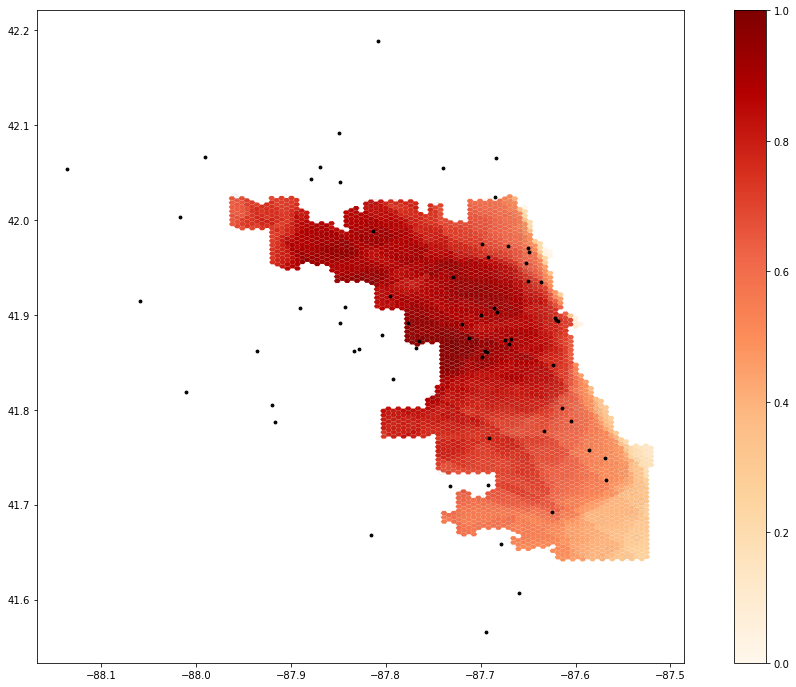
Figure 2. A revised map, using the road network up to a distance of 30 kilometers outside Chicago to avoid hospital displacement errors. This map uses the same weights as the original: 1.00 at 10 minutes, 0.68 at 20 minutes, and 0.22 at 30 minutes.
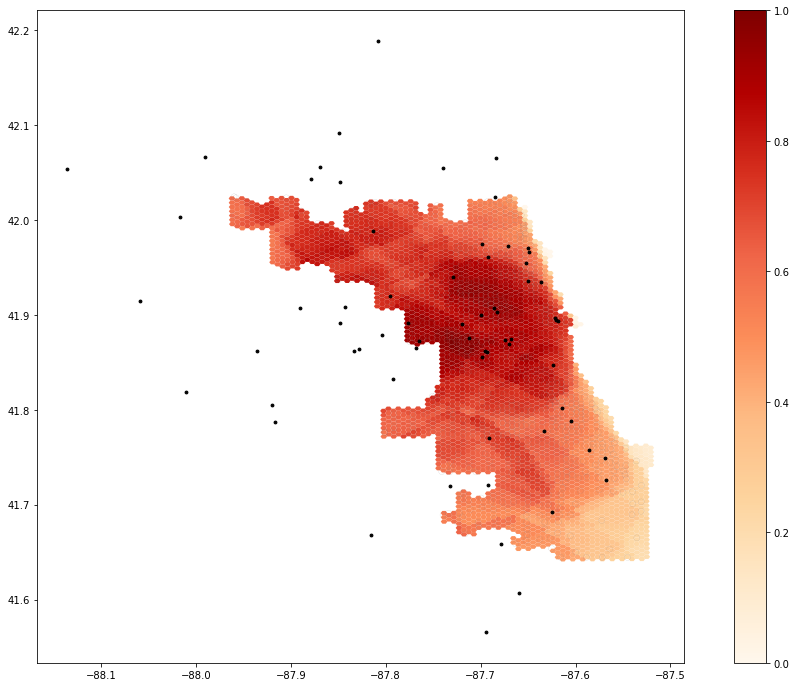
Figure 3. A revised map, using the extended road network and a set of weights reflective of sharper distance decay, as outlined in Luo and Qi (2009). The weights are 1.00 at 10 minutes, 0.42 at 20 minutes, and 0.09 at 30 minutes.

Figure 4. This revised map also uses the extended road network, this time along with a detailed, customized set of weights that represent slower distance decay, which we theorize might make more sense in the context of COVID-19. The weights are 1.00 at 10 minutes, 0.95 at 15 minutes, 0.87 at 20 minutes, 0.75 at 25 minutes, and 0.63 at 30 minutes.
Conclusions
With some reworking and minor edits to the code, the study was easily reproducible, thanks to the publication of a code notebook alongside the paper. Carrying out a reproduction has increased my confidence in the validity of the original analysis, although the reproduction raised some important concerns that should be taken into account going forward. For instance, careful attention should be given to how the road network operates, and how the catchment areas are made – the Jupyter Notebook provides more in-depth information on these fronts than the paper itself does. The sensitivity of the analysis to different choices of weights should also remind us that we are generating theoretical models of hospital accessibility, which sometimes do and sometimes don’t match the actual spatial patterns of access.
Acknowledgements and References
Credit is due to Maja Cannavo for writing code to fix the road network processing step, which initially failed with a larger network that included buggy OSM data. Thanks also to fellow students in GEOG 0323, to Professor Holler for editing the initial reproduction repository to work for this analysis, and to Kang et al for making the code openly available.
Kang, J. Y., A. Michels, F. Lyu, Shaohua Wang, N. Agbodo, V. L. Freeman, and Shaowen Wang. 2020. Rapidly measuring spatial accessibility of COVID-19 healthcare resources: a case study of Illinois, USA. International Journal of Health Geographics 19 (1):1–17. DOI:10.1186/s12942-020-00229-x.
Luo, W., & Qi, Y. (2009). An enhanced two-step floating catchment area (E2SFCA) method for measuring spatial accessibility to primary care physicians. Health & place, 15(4), 1100-1107.